Clima-Sim
Clima-Sim 3.2 now available! Clima-Sim's new (minor May 15, 2026 upgrade of major upgrades in November, 2023) version can be downloaded as an executable installer (for both new and existing customers, as it won't interfere with previous registration) here: climasetup.exe, or with that installer wrapped in zip file here: climasetup.zip, and can be registered here: www.wxsim.com/dnld.htm
Note: check back here soon, as a new release often generates suggestions, and I already have a couple of ideas for small enhancements.
Spurred in part by a curious WXSIM customer (Ton Lindemann) two decades ago, I embarked on an off-and-on quest to created a small climate model that could be run on a personal computer. Many aspects of climate modeling, such as cloud physics, are well beyond my expertise. However, the energy balance aspect of climate modeling was very much down the same alley as the work I'd done for WXSIM. I decided to make a 1296 cell (36 x 36, every 10 degrees of longitude and a variable scale of latitude, to equalize cell areas) 'map of the world', with solar energy in and out, and heat exchange (via advection, primarily) between adjacent cells. I made the surface type user-modifiable, as well as a host of other things, like solar luminosity, axial tilt, orbital eccentricity, and whether or not to include various feedback effects and circulation patterns like ocean gyres and trade winds.
I've worked for many years on this model, tweaking, tuning, and adding features. I calibrated it in a number of ways, but largely by getting its output to match paleoclimactic extremes, such as the Last Glacial Maximum about 20,000 years ago, and the very warm Cretaceous, about 90 million years ago, using all the data I could find regarding global and zonal temperatures, atmospheric composition, solar luminosity, and continental configurations. However, the default values of the various parameters I tuned are still tunable in the program, so that you can do a "world" of experiments and simulations yourself!
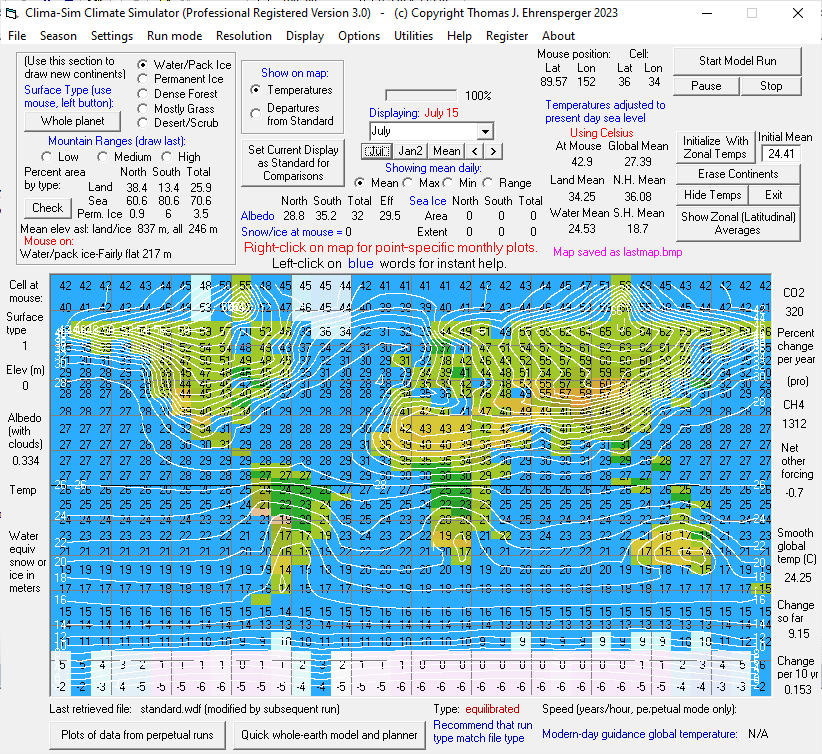
There are a lot of screenshots below, because this program does a lot! Please scroll down to get a feel for this. For starters, here's a simulation of present-day July temperatures:
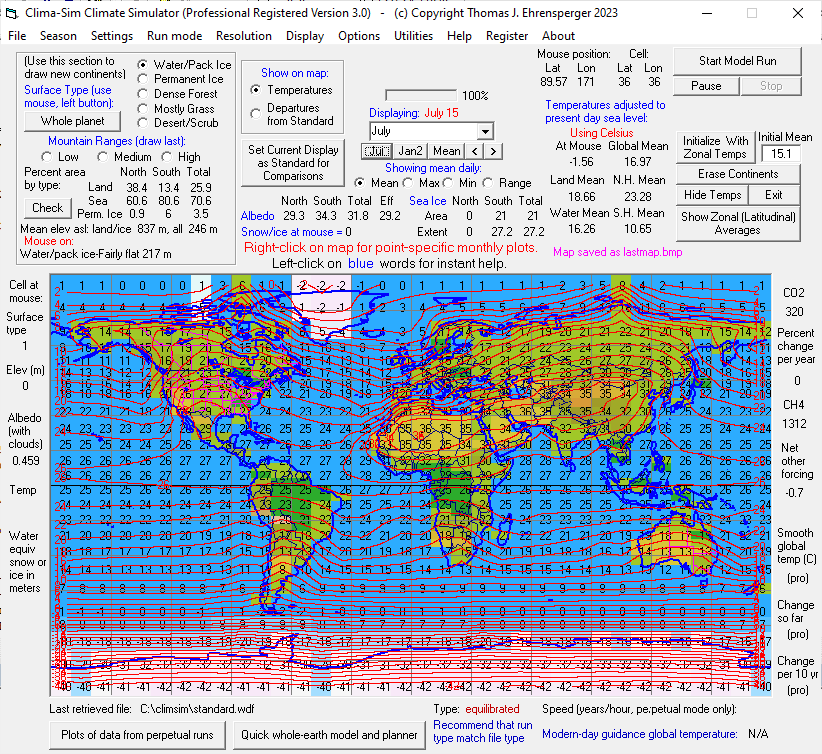
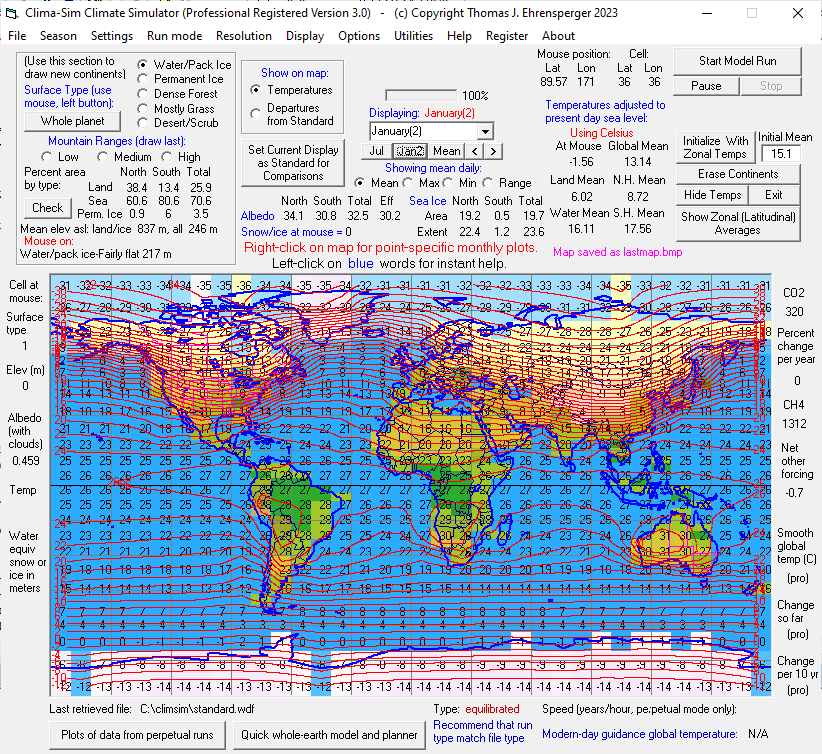
and here's January. Note the expanded snow and ice (lighter colers) in the Northern Hemisphere:
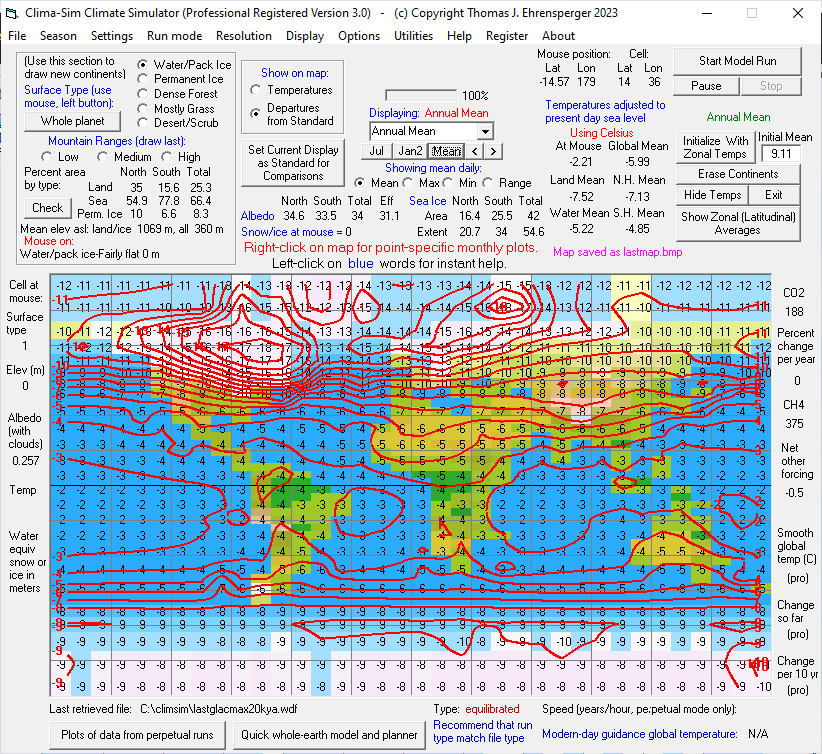
The screen shot below shows continental and ice configurations for the Last Glacial Maximum, about 20,000 years ago, with the numbers and isotherms representing mean annual temperature temperature differences (in Celsius) compared to the period 1951-1980. Here, I've selected not to show the present continental outlines, as there was more land above sea level back then. I used the mouse to add the extra bits of land, and this configuration is one of the "canned" ones that comes with the program. You can easily make and save your own!
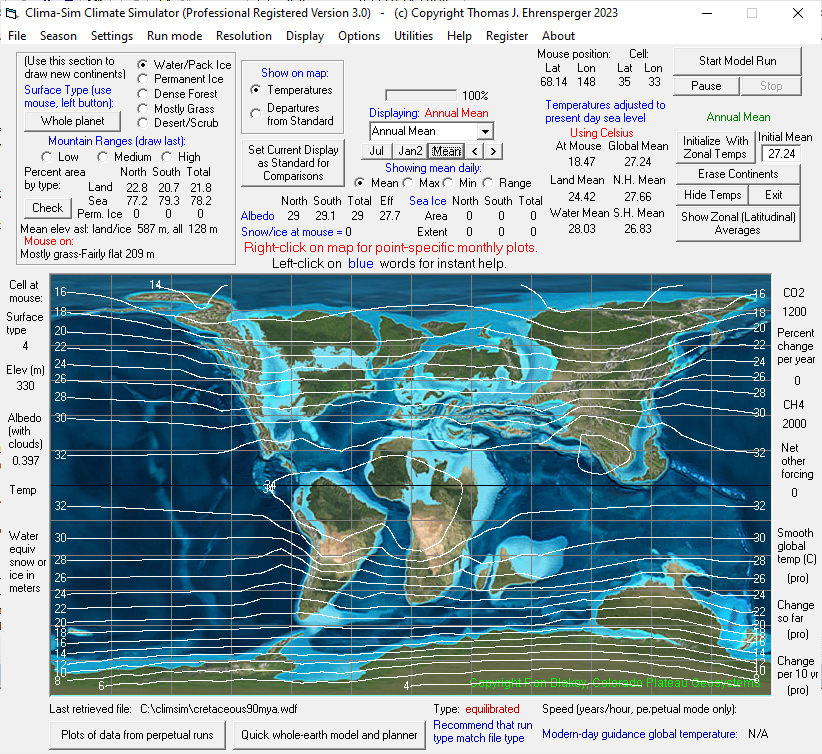
Below is a simulation of mean annual temperatures during the Cretaceous period, about 90 million years ago. This continental configuration is also provided, as is the beautiful graphic, provided by permission of its creator, Ron Blakey of Colorado Plateau Geosystems. This and two other such configurations are included in the Clima-Sim package.
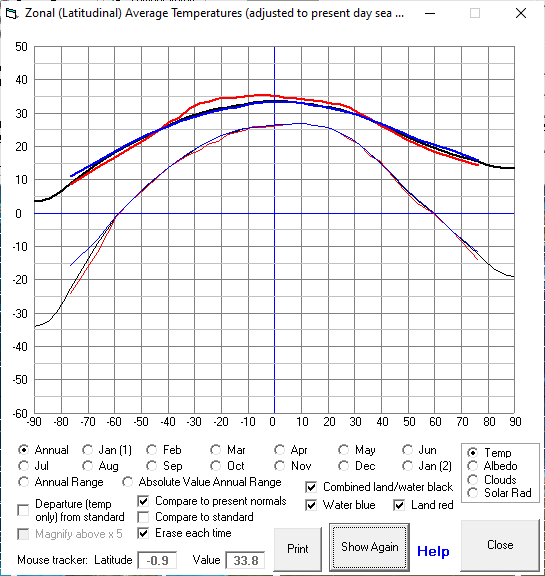
Here are average temperatures by latitude from the above simulation of annual mean during the Cretaceous Period, about 90 million years ago. Thick lines are back then; thin lines are present-day conditions.
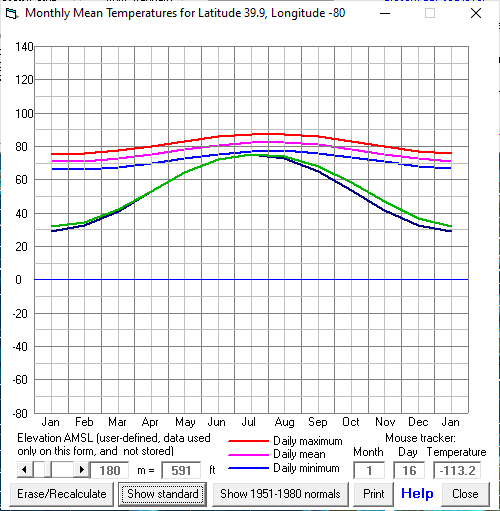
Right-clicking on the map generates a graph of monthly average temperatures (including estimated mean daily minimum and maximum). Here, the mouse was clicked at approximate latitude 40 N, 80 W, which during the Cretaceous was on a strip of land which is now the Northwestern U.S., but now is near Pittsburgh, Pennsylvania. Red, purple, and blue are Cretaceous daily max, mean, and min temperatures, with the very small. Black is actual 1951-1980 mean temperature, and green being modeled for that same period.
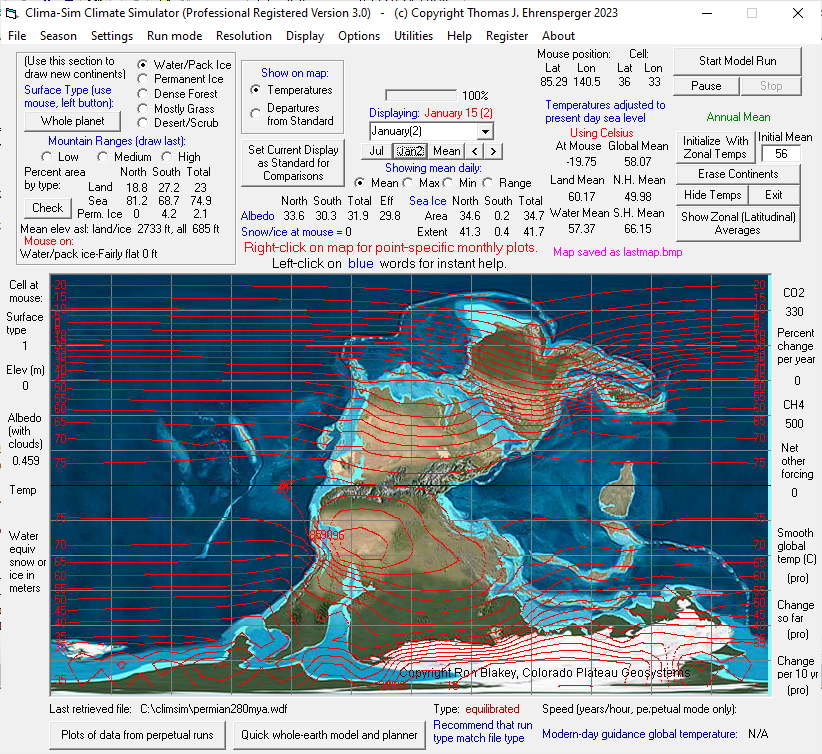
Here is January on the Pangaea supercontinent 280 million years ago. With greenhouse gas concentrations similar to today, but the sun slightly dimmer, temperatures were - if anything - slightly cooler than today, but note the intense heat in the southern hemisphere desert, and yet permanent ice in the south polar region. Strong atmospheric circulation in response to such contrasts this help carry tropical moisture westward into the equatorial mountain range (some of which are now the Appalachians), spurring growth of coal forests (though moreso in the previous, Carboniferous period).
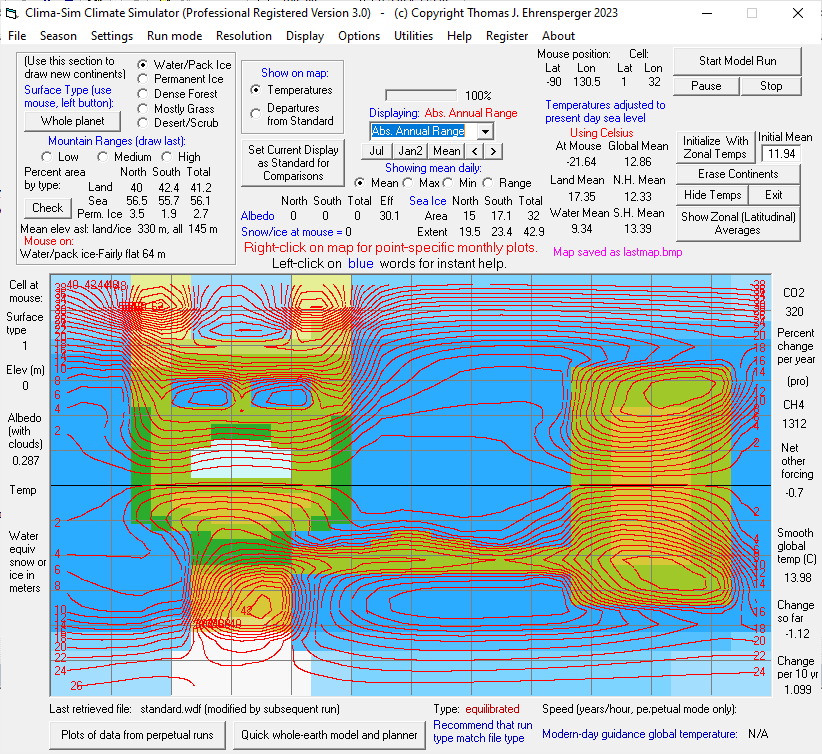
As mentioned above, you can create your own continental configurations, and you can even specify the surface (i.e. vegetation) type and (crude) mountain ranges, which impede atmospheric circulation and are generally colder. Here is the absolute annual temperature range (defined as January minus July, but made positive) for a rather unlikely world! Notice that the annual range is greater at higher latitudes, and greater over land and far from water, as one would expect. However there's a subtle latitude-dependent pattern to this: in the mid latitudes, the isotherms are skewed eastward, due to mid-latitude westerly flow, but in the tropics, they shift westward due to trade winds. Such features are optional and empirically built-in, rather than being a consequence of full general circulation modeling, but the result is largely realistic. Ocean currents (large gyres) are similarly included.
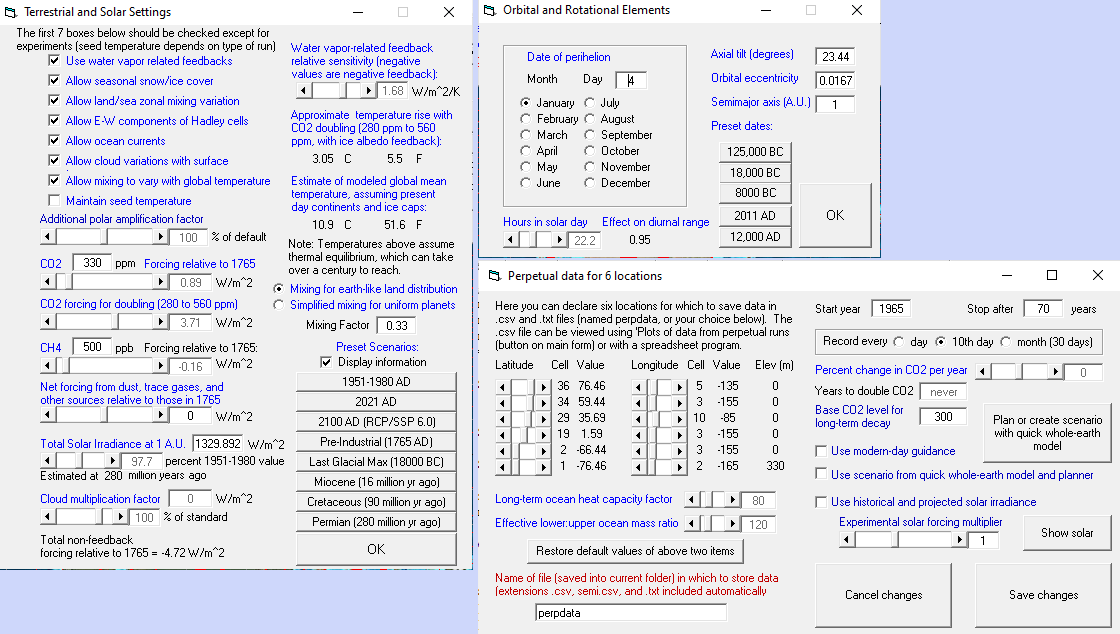
There are many optional settings for terrestrial, solar, orbital, and rotational properties in Clima-Sim, but the defaults are all preset, and you can isolate just one effect at a time, while ignoring the rest. The last form shown is mainly for professional mode, to save data for sea ice and snow cover for selected spots.
Here's the result of an experiment, using modern continental configurations and 1951-1980 forcings, but with the earth's axial tilt increased from the present 23.44 degrees to 45 degrees. This would expand the tropics to meet the Arctic and Antarctic circles, 45 degrees either side of the equator. The effects would be dramatic, especially in the polar regions, which would then not only have 24 hours of daylight in summer, but would have the sun fairly high in the sky. Here you see July under these conditions, with mean temperatures in northern Canada and northern Russia hovering near or over 60 C (140 F). Even the Arctic ocean would get very warm - warmer than any oceans today - and (as seen in runs not shown here) would have so far to cool that it probably wouldn't freeze even in winter. The modern day permanent ice is still shown here, but would quickly melt, allowing even more warming (at least in Antarctica). Other experiments (not shown here), making the tilt zero show ice caps forming down to about 50 degrees latitude in both hemispheres, but the equator remaining at or just above modern temperatures. The tilt we have really matters!
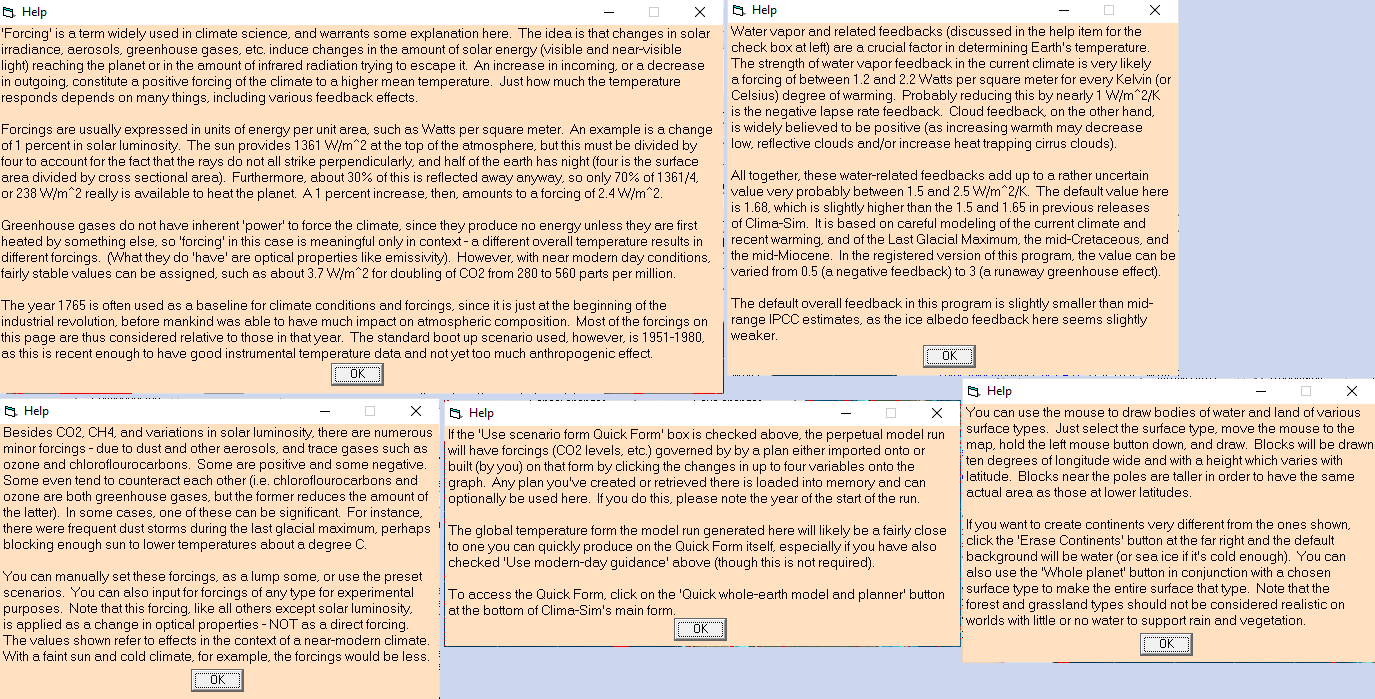
Clicking on any blue caption in Clima-Sim pulls up immediate help and information on that topic. There are 65 such topics in the program. Not only does this make the program user-friendly, but it also allows it to be used as an educational tool, with the context and examples of this information right there to be experienced! Here are a few examples:
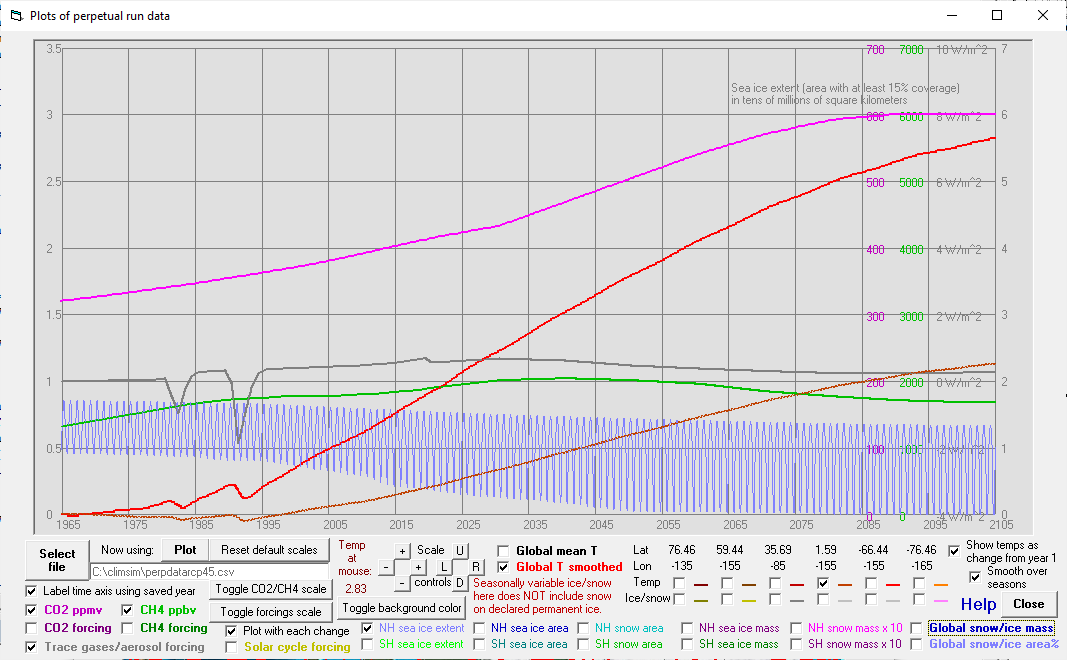
Professional mode includes the ability to make perpetual runs, lasting years or even centuries, and including a sea and land ice model calibrated to behave realistically on a seasonal basis, and likely to remain fairly accurate over multi-decade periods as well. Below is a 140-year run, starting in 1964, using actual historical greenhouse gas and aerosol data, and a projection corresponding closely to the IPCC's RPC (Representative Concentration Pathway) and SSP (Shared Socioeconomic Pathway) "4.5" (for a maximum forcing before 2100 of about 4.5 W/m^2 relative to preindustrial). This scenario and several others are included with the program included with the program (two of them accessible in demo mode and the rest with registration). You can see which items were chosen for display. Global mean temperature rises by about 2.75 C by 2100, and an ocean point near the equator much less. Carbon dioxide concentration levels off at about 600 parts per million. Forcing by aerosols features negative values around 1982 and 1991, from the volcanoes El Chinchon and Pinatubo, repsectively. Arctic sea ice extent in September declines to near zero by 2055, and almost surely to zero each summer by 2075, though it continues to form each winter. This scenario is often consiered a fairly realistic "middle of the road" one, but you can experiment with both higher and lower emissions scenarios.
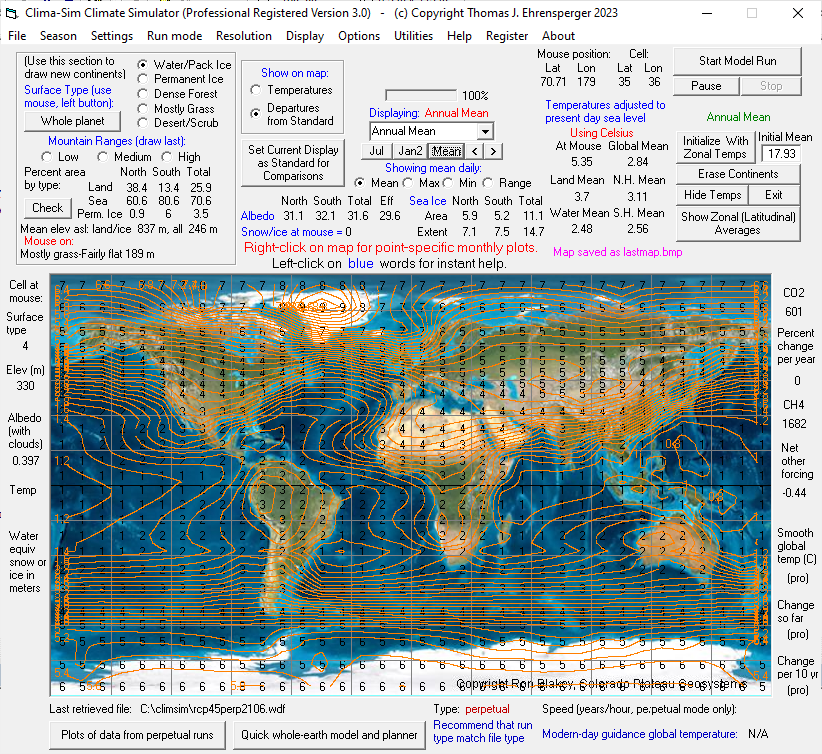
Here is a map showing temperatures changes in this "4.5" scenario, as of 2106 (relative to 1951-1980 average), with a very tight isothem spacing (0.2 C). You can see higher latitudes warming more (especially in the Northern Hemisphere, and land warming more, with the land-water difference being larger in the tropics.
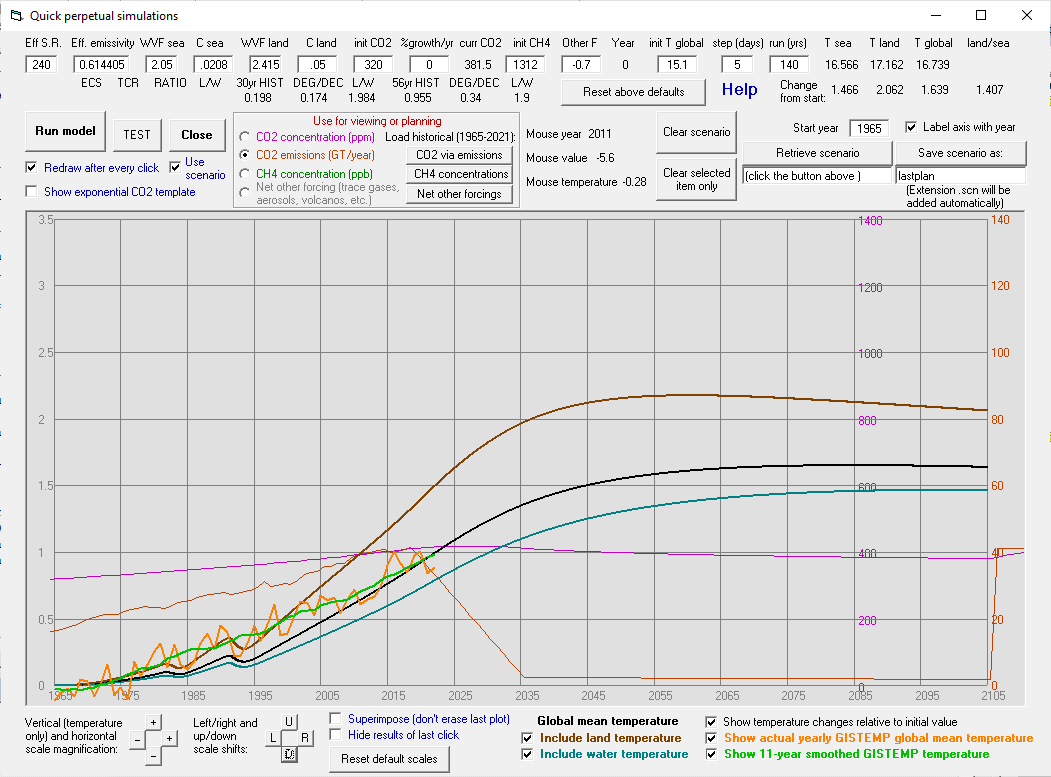
In fact, you can readily create (in registered modes) your own scenarios, and see the resulting effects on global temperature, within a second or two, on the 'Quick' form. Here, I've used historical data up through 2021, and then sent carbon emissions almost (but not quite) to "net zero" by 2035. The result is a gradual, small drop in CO2 concentrations, eventually followed (around 2080) by a peak in global mean temperatures at about 1.7 C above the 1951-1980 average (and about 2 C above preindustrial temperatures). Notice that land warms more than water, but cools sooner. In professional mode, this scenario can be used in a full perpetual run, which progresses much more slowly (about 60-90 years per hour on typical home computers), but has far more detail (such as illustrated on the preceding screenshot), including geographic distribution of temperature changes, and is likely more accurate.
DISCLAIMER
I created Clima-Sim as an intellectual challenge and exercise, in response to a WXSIM user interested in paleoclimatology, and to enable me to explore my own fascination with that subject. Obviously, though, this has relevance to the 'hot topic' of anthrogenic global warming or climate change. I want to make two things clear: (1) I have no 'agenda' with regard to the AGW debate and (2) Clima-Sim does not provide definitive answers regarding that. What is DOES do, though, is to allow users to explore effects of various assumptions. This is why I've made various parameters, like forcing due to greenhouse gases and feedback effects adjustable, rather than giving them fixed, 'authoritative' values. This way, you can run all kinds of 'what if' scenarios, to get a feel for what the effects would likely be, and the patterns that emerge. That said, the default values you'll see are basically mid-range ones from all the literature I could find. The crucial water vapor feedback setting is one I arrived at after exhaustive attempts to match the various paleoclimate scenarios. For what it's worth, this yields a climate sensitivity of almost exactly 3 degrees C for doubling of CO2 from 280 to 560 ppm, well within the IPCC's most recent estimate range from 2.5 to 4 C. I make no claims to know that this is correct. It's just a model! But hopefully really useful and fun one!
Again, Clima-Sim can be downloaded as an executable installer here: climasetup.exe, or with that installer wrapped in zip file here: climasetup.zip, and can be registered here: www.wxsim.com/dnld.htm