Accuracy
This is a section I have been adding to for years, as I've done several verification studies, and have kept almost all of the data here, so much of it is very old "legacy" information. Regarding WXSIM's own accuracy, the new and very extensive data in the preceding section is the most meaningful. However, the earlier studies have the advantage of comparing WXSIM to several other forecast sources (The National Weather Service, its NGM, ETA, and GFS MOS products, The Weather Channel, and even myself!), and I have not tracked the accuracy of those lately. I will first summarize the recent WXSIM verification data, and then do a sort of "meta-analysis" of my earlier studies, so that by cross-referencing, we can get a good idea for how WXSIM likely compares to other sources now.
First, I want to establish a measure of accuracy to which we can "normalize" all results. Let this be the average of the mean absolute error for max and min temperature forecasts, for the first six, starting with the minimum temperature for the day after the forecast was made. Furthermore, let this be weighted equally among the seasons. By this measure, WXSIM's native (no WXSIM-Lite influence) is 2.90 Fahrenheit degrees, for WXSIM-Lite it's 2.68, and for a 60% (near-optimal) WXSIM-Lite mix, it's 2.44.
There will be at least two items to "correct for" in comparing this to older data: average "lead" hours for the forecast, and seasonal effects. To address the first, here is a chart I made of an average of all the 40, 60, and 80% WXSIM-Lite-mix data (approximately equal seasonal representation, but not actually normalized to that).
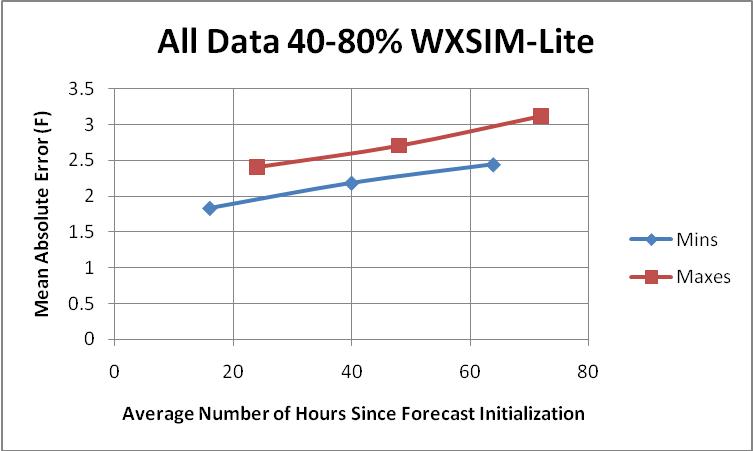
Averaging the max and min coordinates yields an extremely linear (correlation 0.99996!) increase in MAE with time, of 0.0138 degrees per hour (0.331 degrees per day). I will assume this applies to all forecast sources (it probably doesn't, really, but the adjustments will be small, anyway).
In the data above, forecasts were made in roughly equal numbers using data from just before 0700, 1100, 1500, 1900, and 2200 hours local standard time, yielding a lead time of about 16 hours for the next morning's minimum temperature (around 7 AM). The lead-time for afternoon highs, which happen about 8 hours after the lows, was therefore about 24 hours, for an average of 20. In my 2005-2006 study (discussed in more detail in the legacy section below), I did go out to 72 hours, but about half the forecasts were made in the afternoon, using data from about 1600 (lead time for lows and highs about 15 and 23 hours, respectively, for an average of 19), but another half were made about 0700, for a lead time for highs of only 8 hours, and for lows about 24, for an average of 16. So, that's about 17.5 hours lead time compared to the recent data's 20. Therefore, we will add 0.0138 x 2.5 = about 0.03 to old MAE's.
Regarding seasonal effects, the old data spanned August through May, thus leaving out the generally easier-to-forecast months of June and July. The previous section reported MAE's of 2.63 F for spring, 2.04 for summer, 2.28 for fall, and 2.78 for winter, for an average of 2.44, while using only one summer month (August) in the average for 10 months yields an expected MAE of 2.51, or 0.07 degrees worse, so this number should be subtracted from the old values to compensate for their relative lack of summer. The net effect of lead-time and seasonality corrections therefor suggest we subtract 0.04 from the old MAE's.
Applying all these sorts of corrections, effective 6-period MAE's in 2002-2003 (126 forecasts) , 2005-2006 (225 forecasts), and their average (if applicable, weighted by number of forecasts) were:
| Forecast Source | 2002-2003 (126 Forecasts) | 2005-2006 (225 Forecasts) | Weighted Average |
| WXSIM | 3.12 | 2.74 | 2.88 |
| National Weather Service | 2.76 | 2.70 | 2.72 |
| The Weather Channel | 2.85 | 2.45 | 2.59 |
| ETA/NAM Model Output Statistics | 2.94 | 2.94 | |
| AVN/GFS Model Output Statistics | 2.86 | 2.70 | 2.76 |
| NGM Model Output Statistics | 3.18 | 2.91 | 3.01 |
| My own forecast after reviewing above sources | 2.59 | 2.59 |
These show WXSIM clearly beating the ETA (now called NAM) and (now discontinued) NGM, and just slightly behind NWS humans and AVN/GFS, but losing to The Weather Channel by a significant margin. As discussed below, WXSIM showed relative strength early in the forecasts, beating all but TWC for the first two forecast periods, in 2005-2006.
By comparison, the recent seasonally-balanced 100% WXSIM forecast MAE was 2.90, or 0.02 degrees worse than the weighted average of the earlier studies. The program and its data sources have almost certainly improved since then (there may have even been improvement in the 3 years between studies), so what explains this? I believe much of it is that I made the earlier forecasts manually (as compared to the automated recent forecasts), so that some of my data-use decisions may have helped. Perhaps more importantly, the newer data may be contaminated with a small number of data-ingestion failues. Another possibility is that the particular weather situations that dominated the earlier forecast periods were simply easier to forecast (though this is just speculation), or that there is something erratic and hard to forecast about the rooftop weather station used in the 2015-2017 study (in spite of the use of autolearn and learned bias corrections). Note that the data in the preceding section is specific to the rooftop weather station on the building in which I work, and also uses 24-hour min and max temperatures, whereas the earlier studies were forecast for and verified at KATL (Atlanta Hartsfield-Jackson Airport) and used AM minima and PM maxima.
Now consider the effect of adding use of WXSIM-Lite. In the 2015-2017 data, a 60% WXSIM-Lite mix improved WXSIM's MAE from 2.90 to 2.44. It might have improved the earlier data's 2.88 to about the same figure, which might well put the WXSIM system in first place, or perhaps tied with The Weather Channel, if their apparent improvement between the earlier studies was real.
The above strongly suggests that WXSIM, when used with its learned bias corrections and WXSIM-Lite, may be at least as accurate as the National Weather Service or The Weather Channel, in forecasting for a major population center (Atlanta). My belief (buoyed somewhat by reports from WXSIM users) is that WXSIM may have a larger advantage for locations (perhaps yours!) other than official reporting stations, in part because the Model Output Statistics (MOS) products (now NAM and GFS) exist only for official reporting stations, and their guidance clearly helps with the human-assisted forecasts. The "bottom line" is that WXSIM is at least very competitive with the best other temperature forecasts out there, and for many locations, may beat all of them.
Note:What
follows is 'legacy' material, some of which was used to develop the above meta-analysis
Due to the optionally interactive nature of the program, a truly objective study on the accuracy of the program's output is difficult. I have attempted to adopt a very standard set of testing procedures, however, and have devoted a lot of time over the years to documenting WXSIM's accuracy, biases, strengths, and weaknesses. I did this at least as much to improve the program as to determine its validity as a forecast tool.
What follows here is an abbreviated presentation of the major findings. (To download a more detailed presentation of this data, in the form of a 49KB WordPad document, click here).
The output analyzed was forecast maximum (7 AM-7 PM) and minimum (7 AM-8 AM) temperatures at the Atlanta airport (KATL), out to 48 or 72 hours, depending on the study. In all the studies, morning forecasts were made based on data available before 8 AM EST (average ... it varied somewhat, even as early as the midnight before) and afternoon forecasts generally before 6 PM EST (sometimes as early as 1 PM). The actual forecast runs were usually completed within an hour of the time of the data. Comparisons were made with NWS forecasts issued around 5 AM or 5 PM, and with NGM (and in some cases GFS) MOS runs initialized on data from 00Z and 12Z, respectively, available several hours before the WXSIM runs and NWS forecasts. Temperatures were recorded in degrees Fahrenheit.
The largest and most recent study consists of 126 forecasts (48 AM and 78 PM), each out to 72 hours, spanning the period March 24, 2002 to January 26, 2003. The 'competitors' here were Nested Grid Model Model Output Statistics (NGM MOS), GFS (formerly known as AVN) MOS, the official National Weather Service coded city forecast (released about the same times as the WXSIM runs were produced), the latest forecast from The Weather Channel, and me! I made my forecast just after looking at the other sources, adding my judgement and experience to a consensus of the other numbers.
Mean Absolute and Net Errors
Source NGM GFS NWS TWC WXSIM ME
I also conducted 3 earlier significant studies (two even earlier ones are not included here due to small sample size and inconsistent methodology). Considering only data from my standard AM and PM time windows (before 8 AM and 6 PM), these were 80 forecasts from 11/29/95-2/3/96, 87 from 12/17/97-2/26/98, and 50 from 1/14/99-4/3/99. These used various 4.x and 5.x versions of the program, the earliest of which was actually a DOS version.
The earlier studies did not include me or The Weather Channel. They did include some data from the old AVN MOS product, which tended to be a bit cold-biased and about the same overall accuracy as NGM MOS (though perhaps a bit better beyond 24 hours and not as good before). All studies did have in common, though, NGM MOS, NWS, and WXSIM, out to 48 hours, with the same basic methodology, including fairly standard AM and PM forecast times. Presented below are averages for all four data sets: 153 forecasts initialized at an average of 5:24 AM and 190 forecasts initialized at 3:53 PM.
All 343 Forecasts: Mean Absolute Error
|
Source
|
12
hour
|
24
hour
|
36
hour
|
48
hour
|
ALL
|
|
NGM
|
3.14
|
3.18
|
3.37
|
3.95
|
3.41
|
|
NWS
|
2.65
|
2.67
|
2.94
|
3.39
|
2.91
|
|
WXSIM
|
2.15
|
2.81
|
3.16
|
3.65
|
2.94
|
The most general statement to make here is that WXSIM's overall accuracy, on average, was significantly better than NGM MOS, and almost exactly on a par with the newer GFS MOS, out through 48 hours. It was very nearly as good as the humans at the National Weather Service and the Weather Channel through this period.
Note that at 12 hours, WXSIM clearly beat all these sources, both computer and human. Also, note that my personal forecasts were best of all. This is partly from the experience of having watched the weather in my area for the last 30 years, but also from adding WXSIM's output to the list of sources to consider when making my forecast. Having used it for a long time, I tend to know its strengths, weaknesses, and small biases, and can therefore make the most of its output.
One other interesting item to note is that NWS, NGM, and WXSIM all seemed to improve in the recent data as compared to the combined data, which includes forecasts going back several years. The improvement in the WXSIM results would seem to make sense, because a number of improvements to the program were made during this time. NGM and NWS actually showed greater improvement, however. It's quite plausible that the humans gained more tools and experience, thereby increasing forecast accuracy, and even that NGM MOS itself may have improved slightly more statistics to work with, maybe?
I suspect, though, that another factor was that this last set of forecasts, which included warmer months, such as May and June, and settled months, like October, was simply easier to forecast. These conditions actually expose one relative weakness of WXSIM: it doesn't (yet, at least) have a feedback mechanism to 'learn' from its mistakes. I specifically recall some periods during this data set with very persistent weather patterns, with almost no day-to-day change. After a day or two of this, the humans 'caught on' and would virtually 'nail' the forecast, while WXSIM would make consistent, small errors - like under-forecasting the high temperature by two degrees each day. I suspect MOS products also thrive in such an environment. The more active winter season here may erase some of this advantage.
One last note: WXSIM seems to be slightly more reliable when initialized in the afternoon as compared with other times of day or night), both in absolute terms and relative to other sources. This is probably because it initializes better in the well-mixed daytime air as compared with night, when temperature inversions may be common. Advection data are also more reliable in the daytime, for the same reason. These differences are usually slight, however, and the program generally performs quite well at any hour of the day or night.